

You run a few quick checks, everything passes, then users report crashes and slowness you've never seen in your own runs. That disconnect is where app store ratings drop and uninstalls spike. A large share of your user base runs on Android configurations with 2GB RAM, throttled processors, and slow storage, and if your coverage only exercises a high-end profile, you're missing the memory kills, slowdowns under load, and I/O delays that define their experience.
Mobile app performance testing under constrained conditions catches failures that don't appear on a high-end profile: apps killed by the OS under memory pressure, frame rates dropping when the CPU throttles under continuous load, and storage operations adding visible lag on slower-storage configurations. Mobile app performance testing tools like Android Studio Profiler and Xcode Instruments are free and give you CPU, memory, and network visibility, while open-source mobile app performance testing tools like Appium and Espresso automate UI flows across repeated test runs. Performance testing for mobile apps using JMeter covers API load and server response time, but you'll need native mobile app performance testing tools to measure app performance on Android and iOS at the UI layer: startup time, jank rate, heap growth, and battery drain.
Whether you're doing iOS app performance testing with Xcode performance profiling, XCTest performance tests, and XCTMemoryMetric tracking memory across builds, or Android mobile app performance testing with strict mode active and ADB controlling available RAM, the objective is the same: reproduce the limits your most constrained users face every day. Mobile app performance metrics that matter on constrained hardware include cold start time under 3 seconds, consistent frame rates above 50fps, and peak memory allocation that stays within device limits, all tracked on a mobile app KPI dashboard or mobile app metrics dashboard showing performance trends by hardware configuration.
Performance testing mobile apps means building a coverage matrix around the bottom 20% of your user base by RAM and processor, throttling network speed to 2G or 3G, and running continuous load sessions that surface slowdowns under sustained load and background process kills. This guide covers how to set up a constrained test environment, which mobile performance testing tools to use, how to do mobile app performance testing with memory and network limits, and the specific failure modes that surface when you exercise native or hybrid mobile app performance under the conditions your users actually run.
TLDR:
- A large share of users run apps under limited hardware conditions, yet features that render instantly on a high-memory profile can freeze noticeably longer under 2GB RAM and a throttled CPU.
- Memory pressure crashes, slowdowns under sustained load, and slow storage I/O surface when you exercise the constrained conditions users actually face.
- Build your coverage matrix around three configurations: one at the 2GB RAM floor, one at the 3-4GB range, and one OEM-skinned profile from your target market.
- Track peak heap across full sessions, starting at launch but continuing through every interaction—a clean startup means little if your app leaks 30MB per screen.
- Minitap ties each failure to the specific user action that triggered it, in a session recording.
Why Testing Under Constrained Conditions Matters for Mobile App Performance
A large share of people access the internet primarily through Android devices with limited hardware, yet most mobile teams only exercise a high-end, well-resourced profile.
That gap is where app store ratings collapse. A feature that loads instantly with ample RAM can freeze noticeably longer under 2GB of RAM and a throttled CPU, and users in those conditions leave 1-star reviews citing slowness, then uninstall.
Exercising low-end conditions surfaces three failure categories that a happy-path run consistently misses:
- Memory pressure crashes: when available RAM drops to critically low levels, the OS aggressively kills background processes and reclaims memory mid-session, leaving the app in a partially initialized state that surfaces under low-memory constraints.
- Throttling under sustained load: continuous CPU load triggers clock speed reductions that slow screen updates, fire network timeouts early, and stall background tasks in ways a quick happy-path run won't surface.
- Slow storage I/O: many configurations use slower flash, so database reads, image loads, and cache writes that feel instant on a fast-storage profile can add hundreds of milliseconds of visible lag under slower-storage conditions.
Understanding the Hardware Specifications That Matter
The hardware profile that matters for representative performance testing covers processors in the mid-performance range globally (MediaTek Helio G85 or Snapdragon 680 territory), paired with 2-4GB of RAM and GPU architectures like Mali-G52 or PowerVR GE8320. Display resolution is typically capped at 720p, and onboard storage lands at 32-64GB.

The sub-$150 and $150-$300 segments are not the same test target. Devices under $150 ship with 2GB RAM, aggressive battery optimization that kills background processes faster than stock Android, and heavily customized skins. Devices in the $150-$300 range offer 3-4GB RAM with marginally better GPU compute, but OEM skins like MIUI, One UI, and ColorOS still introduce memory management behaviors that diverge from AOSP defaults in ways that can directly affect your app.
Cross-framework solutions that run on both Android and iOS have framework-specific performance behaviors that surface once you exercise real memory and CPU constraints.
Device Fragmentation and Testing Strategy
You can't represent a constrained experience by only exercising a high-end profile. Your users run under conditions like 2GB RAM, throttling after ten minutes of continuous load, and the same memory and processing constraints on iOS.
Here's what that fragmentation looks like in practice:
- Throttling under sustained load: continuous CPU load triggers throttling that drops frame rates and stalls background tasks in ways a quick happy-path run won't surface.
- Memory pressure crashes: under 2GB RAM the OS reclaims memory aggressively, exposing initialization bugs that don't appear on a well-resourced profile.
- OS behavior gaps: API behavior and permission handling can differ across OS versions, so cover the versions your analytics show as most prevalent in your user base.
Pick your coverage matrix by user data, not by what's convenient. Check your analytics for the bottom 20% of configurations by RAM and OS version, then build your matrix around those.
Performance Metrics That Matter on Constrained Hardware
Under constrained conditions, the metrics that matter most are not the same ones you'd watch on a well-resourced profile. Four areas consistently surface problems first.
CPU and Memory
CPU usage above 60% over time will trigger thermal throttling on budget Android hardware. Memory tells the same story faster: track peak heap alongside average, since a single allocation spike can cause an OOM kill that never shows up in your average.
Startup Time
Cold start time is the metric users feel immediately. On low-end hardware, anything above 3 seconds registers as broken. Warm start should stay under 1 second.
Frame Rate
Dropped frames below 60fps are visible on budget screens. Track jank rate separately from average frame time, since a smooth average can hide periodic stutters that feel worse than consistent slowness.
Battery and Network
On low-end devices, excessive wake locks or polling intervals drain batteries faster than on flagships. Pair battery draw with network payload size, since slow processors take longer to parse heavy API responses.
Memory Management and Crash Prevention
On low-end devices, memory pressure is one of the fastest paths to a crash. Android's low memory killer will terminate background processes and, under heavy pressure, foreground apps too. iOS handles this differently but is no less aggressive; the OS sends memory warnings, and if your app doesn't respond by freeing resources, it gets killed.
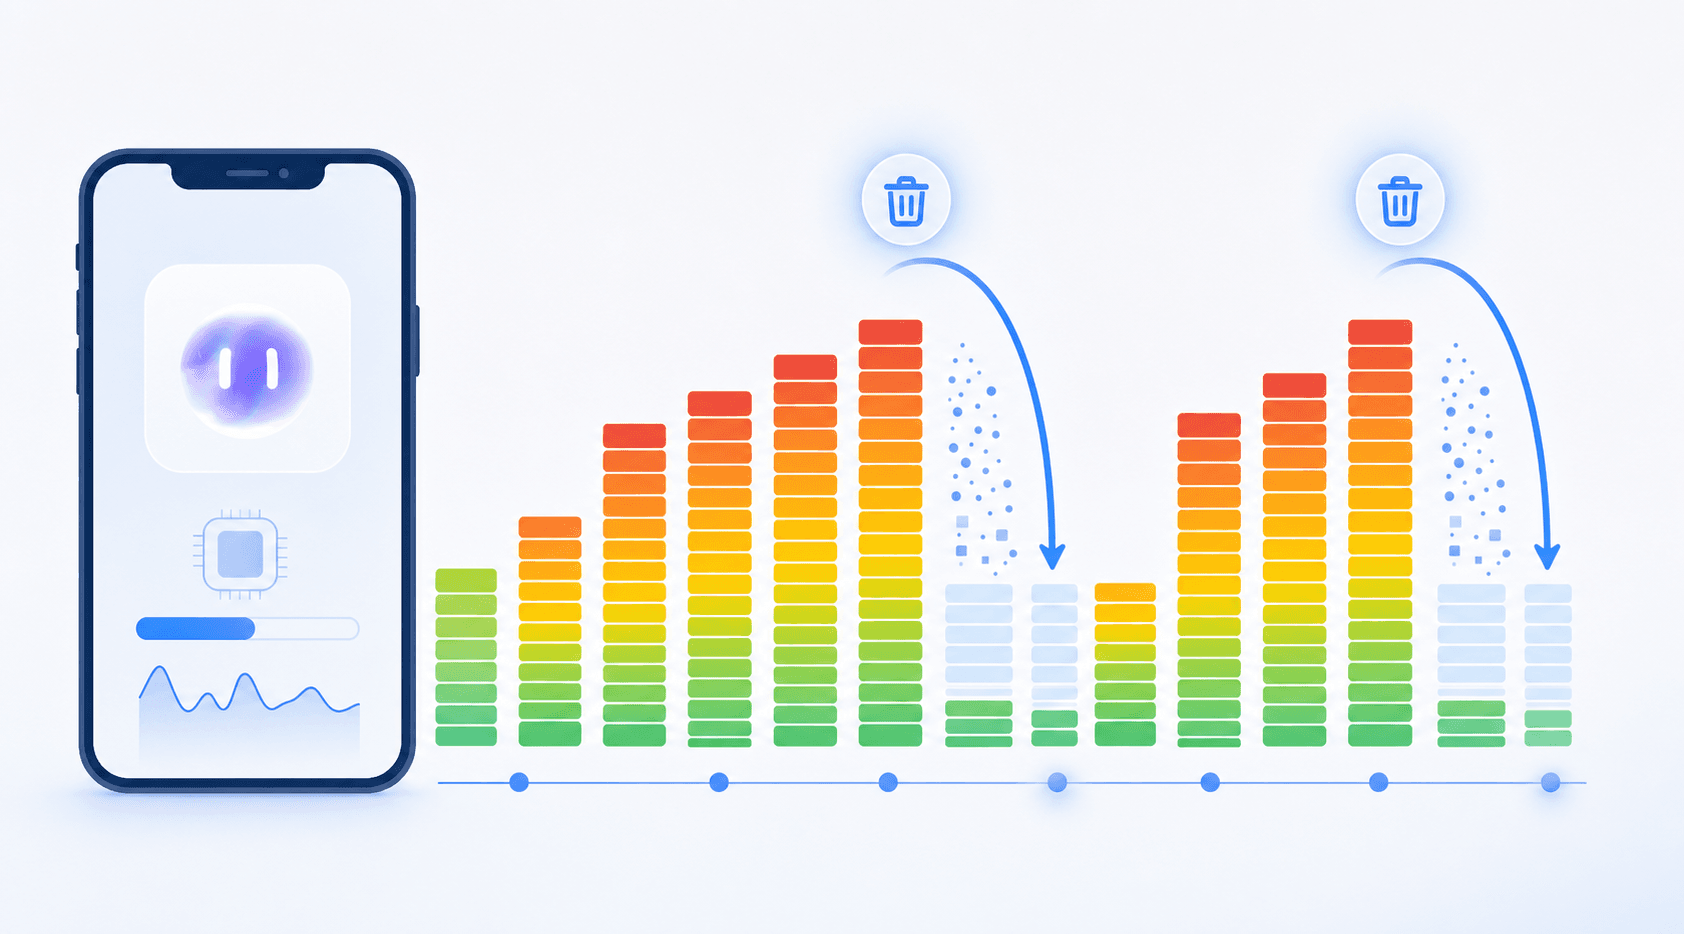
Three failure patterns surface repeatedly in memory management:
- Bitmap objects loaded at full resolution into memory regardless of the display size they'll actually render at, causing heap spikes that trigger crashes on devices with 1-2GB RAM.
- Bitmap objects loaded at full resolution into memory regardless of the display size they'll actually render at, causing heap spikes that trigger crashes on devices with 1-2GB RAM.
- Retained references in listeners or callbacks that prevent garbage collection, growing the heap incrementally until the app is terminated.
- Caches with no eviction policy that grow unbounded across a session, consuming available memory until the OS steps in.
Track heap size over a full user session, beginning at launch and continuing through every interaction. Automated mobile testing approaches surface memory trends across extended sessions far more reliably than manual spot checks. A clean startup number doesn't tell you much if the app leaks memory on every screen transition. Tools like Android Profiler and Xcode Instruments both expose this over time, and XCTest's XCTMemoryMetric gives you baseline comparisons across builds for iOS. The number to watch isn't peak allocation but whether heap size returns to baseline after the user moves back.
Network Performance Testing on Limited Bandwidth
Network conditions your users face rarely match what your test environment assumes. A 2G or 3G connection under real-world conditions behaves nothing like the Wi-Fi-connected environment you ran your last build against.
Throttle your test network to 2G or 3G speeds using tools like Android Emulator's network conditioning or Charles Proxy, then watch how your app handles delayed API responses, dropped packets, and timeout failures. The failures that surface here are the ones real users report.
Key behaviors to test under limited bandwidth:
- Timeout handling: requests that exceed your defined threshold should fail gracefully, not hang the UI indefinitely while the user waits for a response that never arrives. Modern AI mobile app testing tools can detect timeout patterns automatically across network conditions.
- Retry logic: confirm your app retries failed requests with exponential backoff instead of hammering the server or silently dropping the operation.
- Offline state transitions: move from connected to disconnected mid-session and verify the app enters a coherent offline state without crashing or corrupting local data.
- Image and asset loading: heavy assets should either lazy-load or degrade to lower-resolution versions instead of blocking render on slow connections.
Why Performance Under Load Matters
Running under realistic load exposes a class of failures a quick happy-path run won't surface. Throttling, memory pressure from competing OS processes, and GPU constraints all behave differently once the app is exercised under sustained load and tight memory.
Continuous CPU use triggers clock speed reductions that drop frame rates, stall background tasks, and fire network timeouts earlier than a quick happy-path run would predict.
OS Version Fragmentation on Budget Devices
The Android ecosystem spans many active OS versions simultaneously. Google's distribution dashboard shows how fragmentation spans the active install base, with a meaningful portion of users running OS versions several releases behind current. That matters because memory management, background process limits, and WebView behavior differ across those versions.
Test against the OS versions your analytics show your user base is actually running, not just the current release.
Handling OEM Customizations and Skin Variations
Testing on near-stock Android gives you a baseline, but OEM skins like MIUI, One UI, ColorOS, and Realme UI each impose their own memory management rules, background process limits, and battery optimization schemes. An app that passes every performance test on stock Android can still stutter, drain battery faster, or get killed in the background under OEM skins running aggressive memory governors.
A few failure patterns surface repeatedly across OEM-skinned devices:
- Background process termination happens far earlier on MIUI than Android documentation suggests, causing tasks, syncs, and push notification handlers to silently fail for a large portion of your user base.
- Battery optimization whitelists vary by OEM, meaning your app may need explicit user action to run reliably in the background, and that requirement is invisible in standard test runs.
- GPU draw pipelines differ enough between OEM implementations that animations smooth on a Pixel can drop frames consistently on ColorOS or One UI without triggering any alert in your test output.
The practical response is to include at least one configuration from each major OEM skin in your low-end coverage matrix. Behavior diverges at the OS level, so catching it means exercising the OS builds and skins your users actually run.
Setting Up a Constrained Test Environment
Pick two or three configurations that represent your user base. Selection by region varies by market: the bottom 20% in India differs from the bottom 20% in the US.
For Android, the Android Debug Bridge gives you direct memory and CPU controls. You can cap available RAM, reduce CPU clock speed, and trigger memory pressure events to see how your app responds before users do. On iOS, Xcode Instruments paired with XCTest gives you the equivalent access through XCTMemoryMetric and CPU profiling traces tied directly to test runs.
Profiling Configurations to Set Before You Test
Four configuration settings to apply before any test run starts:
- Set background process limits to their lowest allowed values so your app competes for resources the way it does under constrained conditions in the wild, not in a clean idle state.
- Disable WiFi and run on a throttled network connection. Budget device users are frequently on slower connections, and network wait time often accounts for more perceived latency than compute.
- Turn on strict mode on Android to catch disk and network calls on the main thread that won't surface until a slow device makes the timing visible.
- On iOS, activate the Memory Pressure Gauge in Instruments before each session to catch allocations that silently grow across repeated interactions.
The goal is reproducing the conditions your most constrained users already experience under realistic load.
Common Performance Issues Under Constrained Conditions
Four failure patterns appear almost exclusively under constrained conditions, and each has a specific testable trigger.
- Image-heavy flows causing OOM kills: loading a large product grid or photo library under 2GB of RAM will spike heap until the OS terminates the app. Test by repeatedly scrolling through a full image list. Fix by downsampling bitmaps to their actual display dimensions before decode.
- Profile scroll frame times under constrained conditions and continuous load.
- Battery saver terminations: aggressive battery optimization whitelists kick in at much lower thresholds than stock Android. Test with battery saver and Doze mode active. Schedule background work through WorkManager instead of persistent services.
- Thermal throttling during extended sessions: five minutes of video playback or continuous map display drops CPU frequency enough to stall foreground tasks. Run a timed continuous-compute session and watch for frame time spikes after the first few minutes. Defer non-critical background operations during active compute-heavy flows.
Tools and Frameworks for Performance Testing
Low-end condition testing relies on a mix of tools across profiling, automation, and load generation. The right combination depends on your stack, your team's bandwidth for setup, and how much you care about owning the maintenance.
Native Profilers
Xcode Instruments and Android Studio Profiler are the starting points for most teams. Instruments gives you CPU, memory, energy, and disk read/write traces tied directly to your Swift or Objective-C code. Android Studio Profiler does the same for Kotlin and Java, with a Network Profiler tab that surfaces slow API calls under limited bandwidth.
Automation Frameworks
Mobile application testing frameworks like Appium and Espresso handle scripted interaction testing. Appium runs on both Android and iOS but requires selector maintenance as your UI changes. Teams looking to reduce maintenance overhead are moving toward mobile test automation without scripts. Espresso runs in-process on Android, which makes it faster and more stable, but it only covers Android. JMeter works for backend load simulation but does not touch the native UI layer, so pairing it with Appium or Espresso gives you end-to-end coverage.
Free and Open Source Options
| Tool | Target | What It Tests |
|---|---|---|
| Android Studio Profiler | Android | CPU, memory, network, battery |
| Xcode Instruments | iOS | CPU, memory, energy, disk I/O |
| JMeter | Backend | API load and server response time |
None of these require a paid license. The trade-off is setup time and ongoing maintenance, both of which land entirely on your team.
Minitap's Approach to Mobile App Quality
Minitap is a vendor-maintained AI QA agent for iOS and Android that drives your real user journeys the way a thousand users would, on cloud devices, network conditions, data states, and runtime scenarios. Rather than running narrow happy-path scripts, it takes a breadth-first approach designed to reach the failure classes that traditional test suites structurally miss: low-connectivity edge cases, background-to-foreground state restoration, stateful flows, and AI feature regressions that static assertions cannot describe.
Every run produces a coverage report that leads with what was tested, what was not, and what risk remains — so teams can make release decisions with a clear picture of residual exposure rather than guessing from incomplete test output.
Final Thoughts on Closing the Gap Between Test Environments and Real Users
The devices on your desk aren't the ones tanking your app store rating. Users on 2GB phones with slow storage and aggressive battery optimization see a completely different app than you tested. Start with configurations that match your bottom 20%: one at the RAM floor, one step up in specs, and one with the OEM skin your market actually uses. Minitap records what happened when things broke, so you're not guessing from incomplete test output.